
 Peter Selman
The current decline looks set to continue in 2010 and onward, Dr. Peter Selman of Britain's Newcastle University told Family Helper (www.familyhelper.net).
Dr. Selman is an authority on international adoption statistics. His new survey of intercountry adoption in the 21st century will appear as a chapter in Intercountry Adoption: Policies, Practices and Outcomes, edited by Judith Gibbons and Karen Rotabi (Ashgate 2011, forthcoming).
International adoption is complex: in 2009 around 30,000 children left their birth country and moved to a new country often thousands of miles away. China still leads as a source country, sending about 5,000 children to adoptive homes abroad in 2009 (see Table 1 below). U.S. families adopted the most children from other countries: 12,753 in fiscal year 2009 (see Table 2 below).
For decades, until 2004, the numbers had gone steadily upward. In his article "The rise and fall of intercountry adoption in the 21st century" (pdf), (International Social Work, September 2009), Dr. Selman charted how intercountry adoption (ICA) developed over ten years—1998 to 2007—in 22 countries.
He found remarkable changes. Ever since the first children left South Korea in 1953 the numbers rose yearly, to over 45,000 worldwide in 2004. But although the number of applicants in receiving countries kept growing, the global number of adoptions started falling: by 17% between 2004 and 2007.
Dr. Selman sent Family Helper the following tables and graphs, which update these figures to 2009, and chart the rise and fall of ICA in the first decade of the new millennium.
Where the children came from
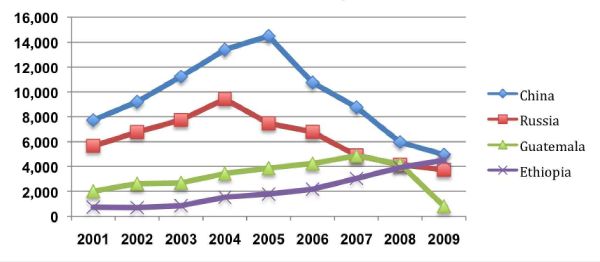
In the last ten years, China has sent more children to adoptive families abroad than any other country, but its numbers are now headed downward (for reasons explained in "U.S. adopts the most Chinese children").
• Table 1 shows the pattern of adoption from 2003 to 2009 in the 15 countries sending the most children for adoption over this period. There is a clear decline since 2005 in the number of children adopted from China. Ethiopia stands out as the only country to show increases every year from 2003 to 2009, when it was heading for first position.
• Figure 1 highlights the trend for the four countries (China, Russia, Guatemala, Ethiopia) which sent the most children to 23 receiving countries in the period 2001-2009.
Table 1. 15 countries sending the most children for intercountry adoption, 2003-2009
| 2003-09 | 2003 | 2004 | 2005 | 2006 | 2007 | 2008 | 2009 | |
| China | 69,667 | 11,228 | 13,404 | 14,493 | 10,740 | 8,757 | 5,967 | 5,078 |
| Russia | 44,471 | 7,745 | 9,425 | 7,471 | 6,783 | 4,873 | 4,135 | 4,039 |
| Guatemala | 24,013 | 2,677 | 3,424 | 3,857 | 4,227 | 4,844 | 4,185 | 799 |
| Ethiopia | 17,822 | 854 | 1,527 | 1,778 | 2,172 | 3,031 | 3,896 | 4,564 |
| S. Korea | 12,184 | 2,287 | 2,258 | 2,101 | 1,899 | 1,264 | 1,250 | 1,125 |
| Ukraine | 11,827 | 2,052 | 2,021 | 1,982 | 1,053 | 1,619 | 1,577 | 1,523 |
| Colombia | 11,248 | 1,750 | 1,741 | 1,470 | 1,629 | 1,626 | 1,617 | 1,415 |
| Vietnam | 8,900 | 935 | 483 | 1,190 | 1,364 | 1,692 | 1,739 | 1,497 |
| Haiti | 7,552 | 1,055 | 1,159 | 921 | 1,063 | 748 | 1,368 | 1,238 |
| India | 6,351 | 1,172 | 1,062 | 857 | 798 | 978 | 759 | 725 |
| Kazakhstan | 5,420 | 861 | 903 | 823 | 699 | 753 | 723 | 658 |
| Philippines | 3,538 | 400 | 414 | 499 | 474 | 564 | 598 | 589 |
| Brazil | 3,377 | 470 | 478 | 473 | 518 | 485 | 485 | 468 |
| Thailand | 2,999 | 489 | 499 | 465 | 414 | 424 | 371 | 337 |
| Poland | 2,745 | 346 | 406 | 409 | 395 | 381 | 407 | 401 |
|
Total sent from all countries | 271,993 | 41,538 | 45,298 | 43,712 | 39,462 | 37,258 | 34,774 | 29,951 |
Source: Statistics for 23 receiving countries. Korean figures are from Ministry of Health and Welfare.
With revisions of Mar. 21, 2011
Figure 1. Adoptions from top four source countries, 2001-2009
Where the children went
Intercountry adoptions (ICAs) peaked in 2004 at 45,298 and fell to 28,594 in 2009, a decrease of 37% in six years. While some countries did show increases over those six years (Italy, Canada), most went down. The United States displayed a most dramatic drop, from 22,884 to 11,780, or 49%. Still, the U.S. dominated the global figures for receiving countries in 2009, accounting for the movement of 43% of children involved in international adoption. European countries now take 49% of the children, a large increase from 2003 when the US accounted for 52%.
• Table 2 shows ICAs for the top 15 receiving countries from 2003 to 2009.
• Figure 2 displays ICA trends using totals from 23 receiving countries, with the peak in 2004. The four lines show worldwide numbers, the top five countries (U.S., Italy, France, Spain, Canada), the U.S. alone, and Europe.
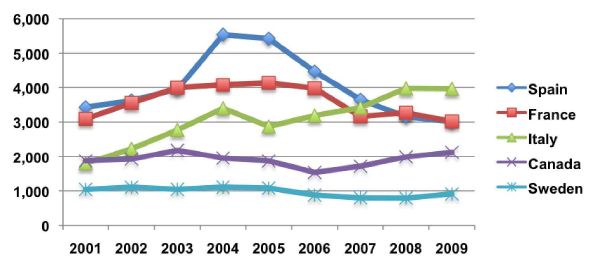
• Figure 3 highlights five major receiving countries after the U.S. (Spain, France, Italy, Canada, Sweden).
As for where the children from China went, see a detailed look at the top seven countries accepting Chinese children from 2001-2009 in the table "Intercountry adoptions from China", in the article on China statistics.
Table 2. 15 countries receiving the most children, 2003-2009
| 2003-09 | 2003 | 2004 | 2005 | 2006 | 2007 | 2008 | 2009 | |
| U.S. (FY) | 137,711 | 21,616 | 22,884 | 22,728 | 20,679 | 19,613 | 17,438 | 12,753 |
| Spain | 29,197 | 3,951 | 5,541 | 5,423 | 4,472 | 3,648 | 3,156 | 3,006 |
| France | 25,637 | 3,995 | 4,079 | 4,136 | 3,977 | 3,162 | 3,271 | 3,017 |
| Italy | 23,597 | 2,772 | 3,402 | 2,874 | 3,188 | 3,420 | 3,977 | 3,964 |
| Canada | 13,291 | 2,180 | 1,955 | 1,871 | 1,535 | 1,713 | 1,915 | 2,122 |
|
TOP FIVE | 229,433 | 34,514 | 37,861 | 37,032 | 33,851 | 31,556 | 29,757 | 24,862 |
| Netherlands | 6,689 | 1,154 | 1,307 | 1,185 | 816 | 778 | 767 | 682 |
| Sweden | 6,622 | 1,046 | 1,109 | 1,083 | 879 | 800 | 793 | 912 |
| Germany | 4,480 | 674 | 650 | 560 | 583 | 778 | 664 | 571 |
| Norway | 3,521 | 714 | 706 | 582 | 448 | 426 | 298 | 347 |
| Denmark | 3,404 | 523 | 528 | 586 | 447 | 429 | 395 | 496 |
| Switzerland | 3,140 | 664 | 567 | 389 | 410 | 394 | 367 | 349 |
| Belgium | 2,917 | 430 | 470 | 471 | 383 | 358 | 364 | 441 |
| Ireland | 2,642 | 358 | 398 | 366 | 313 | 392 | 422 | 393 |
| Australia | 2,447 | 278 | 370 | 434 | 421 | 405 | 270 | 269 |
| UK | 2,147 | 301 | 333 | 369 | 363 | 356 | 225 | 200 |
|
Total, 23 countries | 271,993 | 41,538 | 45,298 | 43,712 | 39,462 | 37,258 | 34,774 | 29,951 |
(FY 2003 = Oct. 2002 to Sept. 2003)
• Totals are for 23 countries. The other eight receiving countries (ranked by number taken over the period) were Finland, Israel, New Zealand, Luxembourg, Malta, Iceland, Cyprus and Andorra.
Source: Statistics issued by the Central Authorities of the 23 receiving states, including submissions to the Hague Special Commission of June 2010.
Figure 2. Trends in intercountry adoption, 2001-2009
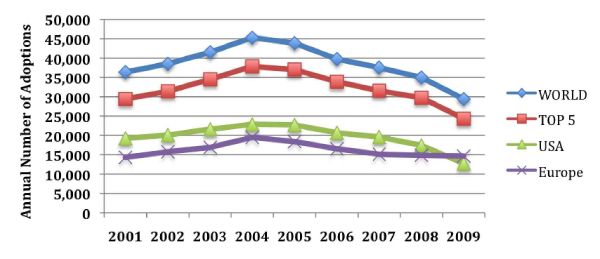
Figure 3. Adoptions to five receiving countries, 2001-2009
ICA trends in four regions
There are well over 100 countries sending children for intercountry adoption (ICA)—too many to review individually. In analyzing the changes in ICA, Dr. Selman found it useful to divide the source countries into four regions:
• Asia grew by 2005 to be the main source region (53%), thanks to the growth of adoption from China (peaking in 2005 at 14,493 children in one year) and continuing high levels of adoption from South Korea. Asia still dominates even though adoptions from China had dropped four years later to 5,068. The downturn was triggered by a decision of Chinese authorities in 2006 to allow fewer adoption applications from foreigners and to focus more on domestic adoption (see article on China statistics). South Korea followed suit, stressing placements within its own borders; it is moving towards a long-promised ending of ICA after 55 years. Meanwhile, Cambodia, Nepal and Vietnam have been shown to have many problems and the U.S. is currently discouraging adoptions from all three.
• Latin America was an early source of children, most recently from Guatemala and Colombia, which both stayed in the top ten sending countries in 2009. Guatemala rose from 1,347 transnational adoptions in 1998 to 4,185 in 2008, only to drop to 799 in 2009. The abrupt change resulted from the U.S. refusing to accept new applications starting in 2007 (because Guatemalan adoption law does not conform to provisions of the Hague Adoption Convention). Haiti is now second to Colombia as a source of children for ICA from Latin America.
• Europe has had its ups and downs. A surge in adoptions from Romania began in 1990 followed by other eastern European countries (Belarus, Bulgaria, Russia, Ukraine). By 2001 Eastern Europe accounted for 37% of ICAs in the U.S. Then Romania and Bulgaria sought membership in the European Union and sharply reduced the numbers of children they sent, Romania going so far as to end all ICAs by non-relatives in 2005. Russia also sent progressively fewer children after 2004, over concerns in the media about Russian children abused or murdered by their adoptive parents abroad.
• Africa alone has shown growth in ICAs, to 15% of the total by 2007. In the 1980s and 1990s only two countries—Ethiopia and Madagascar—featured as sending countries. While Madagascar reduced numbers significantly after 2003, numbers from Ethiopia rose rapidly so that in 2009 it is second to China, while other African countries—Liberia, Nigeria, South Africa and the Democratic Republic of Congo—have emerged as potential major sources of children.
The future of intercountry adoption
After a decade of growth up to 2004, intercountry adoption figures started falling, as fewer and fewer children became available from source countries. Will the decline continue? Dr. Selman believes it should do so in the immediate future but that trends in 2010-2020 will depend on a number of factors. He comments on the future of intercountry adoption in the article "Expert sees further slide in intercountry adoption".
_____________
Dr. Peter Selman is visiting fellow at Britain's Newcastle University. He is advisor on statistics for the Special Commission on Intercountry Adoption set up by the Hague Conference on Private International Law. He is also chair of the Network for Intercountry Adoption and a Trustee of the British Association for Adoption and Fostering.
Dr. Selman (pfselman@yahoo.co.uk) specializes in the demographics of intercountry adoption: how it changes over time between various countries, and which countries send and receive the most children. He has published many articles on the worldwide impact of international adoption, most recently "The rise and fall of intercountry adoption in the 21st century", International Social Work, 52-5: 575-594 (September 2009) (pdf).
Versions of the tables and graphs in this article will appear in Dr. Selman's chapter, "The rise and fall of intercountry adoption in the 21st century", in J. Gibbons and K. Rotabi (eds.), Intercountry Adoption: Policies, Practices and Outcomes, due out in late 2011.
More on international adoption
For the future of international adoption: "Expert sees further slide in intercountry adoption".
Adoptions from China are headed downward. This article explains why: "U.S. adopts the most Chinese children".
Adoptions from Ethiopia are also set to drop. See: "Ethiopia puts the lid on international adoption".
For the future of adoptions from Haiti, see "When will Haitian adoptions start again?".
________________________________________
You may reproduce this item with the credit:
"From Family Helper, www.familyhelper.net"
 FERTILITY
 ADOPTION
 POST-ADOPTION
 FAMILY TREE